Latest Articles
April 24, 12:23 pm
Hashlabs Mining to Fight the Cold Finnish Winter With Bitcoin Mining
April 24, 12:22 pm
PayPal to Promote Low-Carbon Energy in Bitcoin Mining
April 24, 12:21 pm
“Buy Bitcoin” Sign from Janet Yellen Testimony Fetches $166,000 in Auction
April 24, 12:17 pm
Bitfinex Predicts Bitcoin Demand to Outstrip Supply by 5x
April 24, 12:15 pm
Bitcoin For Kids: Educational Resources
April 23, 12:29 pm
Exclusive: Swiss Bitcoiners Push for National Bank’s Bitcoin Reserves
April 23, 12:28 pm
Lightning Network Can Enable Frictionless API Monetization
April 23, 12:26 pm
Mt. Gox Exchange Repayment Updates: Market Impacts
April 23, 12:25 pm
Bitcoin Transaction Fees Plummet After Record High: What Happened?
April 23, 12:22 pm
Bitcoin Bounces Back: Halving Effects To Manifest in 100 Days
April 23, 12:21 pm
Bitrefill and Use of Bitcoin For Everyday Purchases
April 22, 1:13 pm
Mitigating Risk Through Bitcoin Self Custody
April 22, 12:16 pm
IRS Reveals Draft Form for Digital Assets Tax in 2025
April 22, 12:14 pm
Grayscale Reveals Bitcoin Mini Trust Fees, Analyst Calls it ‘Hypothetical’
April 22, 12:12 pm
FTX Investors Seek Settlement with SBF for Info on Celebrity Promoters
April 22, 12:11 pm
Bitcoin Investment on the Rise: Wealth Managers Expected to Join
April 22, 12:08 pm
What is Bitcoin Mining? A Comprehensive Guide
April 21, 12:25 pm
Human Rights Foundation Launches “Finney Freedom Prize”
April 21, 12:24 pm
Bitcoin Halving Complete: What Comes Next?
April 21, 12:23 pm
Bitwise CIO Expects Substantial Price Rally for Bitcoin Post-Halving
Hashlabs Mining to Fight the Cold Finnish Winter With Bitcoin Mining
PayPal to Promote Low-Carbon Energy in Bitcoin Mining
Hashlabs Mining to Fight the Cold Finnish Winter With Bitcoin Mining
“Buy Bitcoin” Sign from Janet Yellen Testimony Fetches $166,000 in Auction
- Editor’s Picks
Bitcoin Miner Manufacturer Auradine Secures $80M Funding
Marathon CEO Believes Halving is Already Priced In
Grayscale CEO Optimistic: Bitcoin ETF Outflows Approach Equilibrium
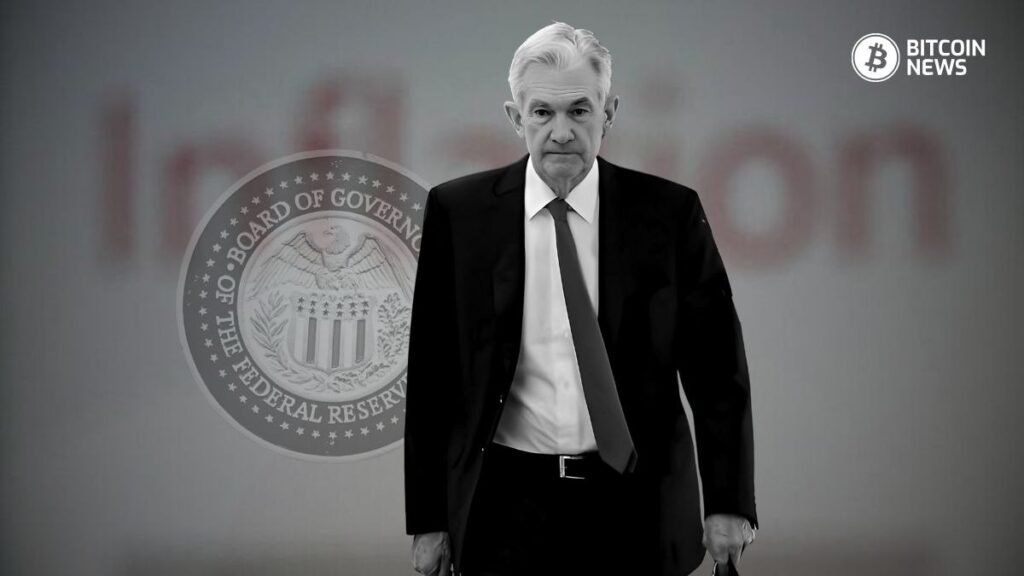
Hopes of Rate Cut Wane as Inflation Persists: Comparing Narratives
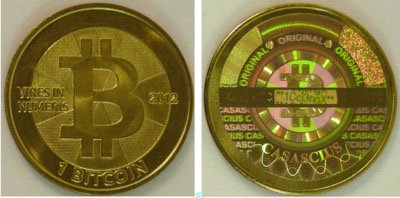
The First Bitcoin Physical Coin: Creation, History, And Evolution
Bitcoin Only
Newsletter
Weekly news roundups direct to your inbox!
Bitcoin Only
Newsletter
Weekly news roundups direct to your inbox!
Media Partners
We’re a Bitcoin-focused media outlet reporting on breaking news and updates. Our mission is to promote education and awareness by sharing and honest and accurate market news to help accelerate adoption.
We’re a Bitcoin-focused media outlet reporting on breaking news and updates. Our mission is to promote education and awareness by sharing and honest and accurate market news to help accelerate adoption.


