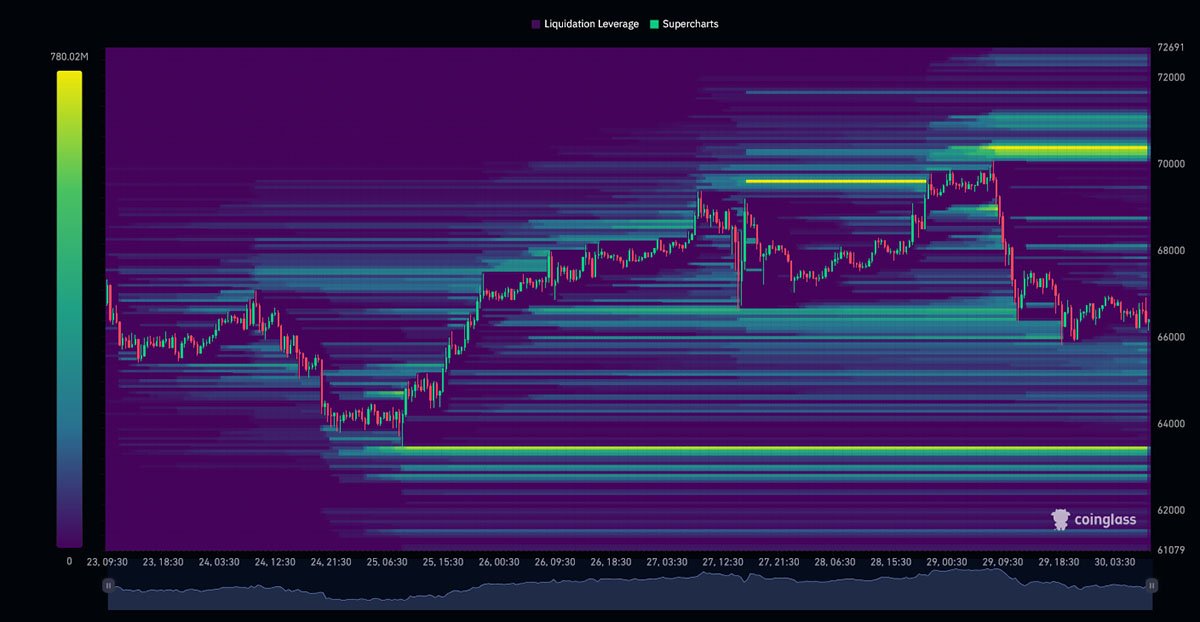
Due to its significant price volatility, bitcoin has been a focal point for traders and investors. Among the various tools and metrics used to analyze bitcoin markets, the liquidation heatmap stands out for its ability to provide visual insights into market behavior.
This article delves into the concept of the Bitcoin liquidation heatmaps, explaining what they are, how they work, and their significance in trading.
What is a Liquidation Heatmap?
A liquidation heatmap is a graphical representation that shows liquidation areas in the Bitcoin market.
Liquidations occur when traders’ leveraged positions are automatically closed by the exchange because their margin balance falls below the required maintenance margin.
This often happens during sharp price movements. In other words, it shows where bitcoin traders’ positions are automatically closed by the exchange when they don’t have enough funds, often happening during big price swings.

The heatmap highlights clusters of these liquidation events, with color intensity indicating the frequency or volume of liquidations at specific price levels. Lighter areas represent higher concentrations of liquidations, while darker areas indicate fewer liquidations.
How Does Bitcoin Liquidation Heatmap Work?
Liquidation heatmaps are generated by analyzing data from trading exchanges that offer leveraged trading. Here’s a step-by-step breakdown of how they work:
- Data Collection: Exchanges collect data on all trades and liquidations. This includes the size of the position, leverage used, and the price at which the liquidation will occur.
- Data Aggregation: The collected data is aggregated to identify patterns and clusters. For instance, if multiple liquidations occur around a specific price level, this information is grouped together.
- Heatmap Generation: Using the aggregated data, a heatmap is created. The horizontal axis typically represents the price levels, while the vertical axis shows the intensity or volume of liquidations. The color gradient visually represents the concentration of liquidation events.
A video, hosted by Max from “Because Bitcoin”, provides an in-depth tutorial on using Hyblock Capital’s tools to analyze bitcoin trading.
It specifically focuses on the Liquidation Heatmap and Open Interest Profile tools, demonstrating their functionality and application in trading strategies.
Importance of Liquidation Heatmaps
1. Market Sentiment Analysis: Liquidation heatmaps provide insights into market sentiment.
Large clusters of liquidations can indicate panic selling or forced buying, suggesting high market stress. This can help traders gauge the overall mood of the market and predict potential reversals or continuations in price trends.
2. Identifying Support and Resistance Levels: Liquidation heatmaps can help identify key support and resistance levels.
For instance, a high concentration of short liquidations (where traders betting on price drops are forced to buy back) can indicate a strong support level. Conversely, a cluster of long liquidations (where traders betting on price rises are forced to sell) might suggest a resistance level.
3. Risk Management: For traders, understanding where liquidations are occurring can be crucial for risk management. By analyzing the heatmap, traders can avoid entering positions near high liquidation zones, reducing the risk of being caught in a liquidation cascade.
4. Strategic Planning: Professional traders use liquidation heatmaps for strategic planning. By anticipating potential liquidation points, they can set their stop-loss and take-profit levels more effectively. This strategic planning can lead to more disciplined and profitable trading.
A Case For Not Selling Bitcoin
Bitcoin has become more than just a currency; it’s a cultural phenomenon that challenges conventional views on money, value, and systems control.
Holding bitcoin aligns one with a community that is often deeply invested in discussing and shaping the future of technology, economy, and society. This community aspect can be a significant draw, as it connects individuals with like-minded people around the world.
Bitcoiners believe in a long-term vision where Bitcoin plays a pivotal role in global finance. Bitcoin, as a store of value and a medium of exchange, could one day reduce the world’s reliance on fiat currencies.
Holding bitcoin can be seen as holding a piece of the future financial infrastructure — a stake in a potential new order that is more equitable and distributed.
Additionally, The sale of bitcoin can trigger capital gains taxes in many jurisdictions. The tax implications can be complex and vary widely depending on the country, the amount of gain or loss involved, and how long the bitcoin was held.
Navigating these tax laws can be confusing, and improper handling can lead to significant tax liabilities.
Conclusion
Bitcoin liquidation heatmaps are powerful tools for traders, offering visual insights into market dynamics and helping to identify critical price levels.
By understanding how to interpret these heatmaps, traders can enhance their market analysis, improve risk management, and make more informed trading decisions.
As the Bitcoin market continues to evolve, tools like liquidation heatmaps will remain essential for navigating the complexities of bitcoin trading.


