Bitcoin has been on a notable upward trajectory recently. Bitcoin analyst Willy Woo believes that bitcoin has significant potential for further upside price growth, highlighting key indicators that suggest a bullish trend.
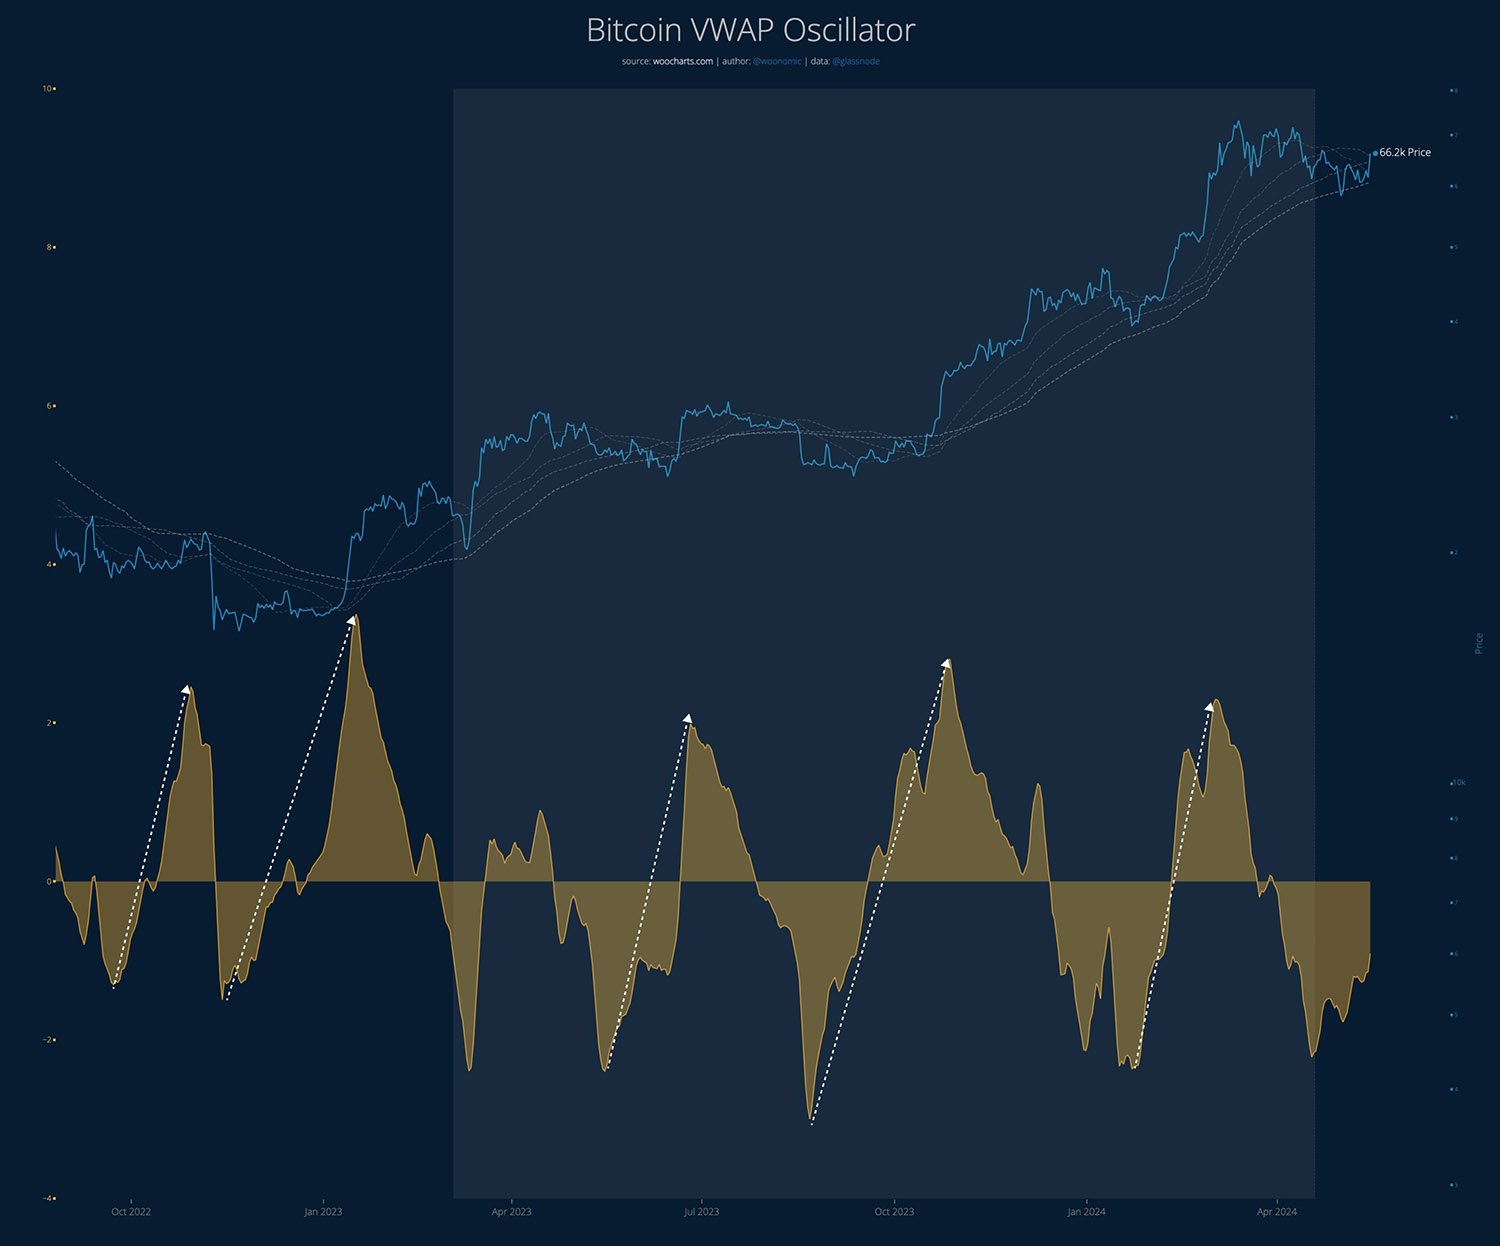
One of the primary tools Woo uses to predict bitcoin’s future is the Volume-Weighted Average Price (VWAP) Oscillator. Woo’s insights, along with various market data, point to a promising future for the digital asset.
This technical indicator provides a nuanced view of price movements by considering the volume of transactions at each price level. Essentially, it gives more importance to prices with higher trading volumes, offering a balanced perspective on market trends.
In a series of posts on social media platform X, Woo explained the significance of the VWAP Oscillator. He highlighted that it tracks the ratio between bitcoin’s current price and its VWAP, oscillating around a zero point.
When the Oscillator is in negative territory but starts moving upward, it often signals the beginning of a bullish phase for bitcoin.
Recent trends show the VWAP Oscillator has been negative for months but is now rising. If this continues, it may soon hit neutral, indicating a potential market shift.

This pattern suggests that bitcoin might experience further gains until the Oscillator peaks in positive territory and then starts to decline. Woo summarized this by stating:
“Still a lot of room to run before reversal or consolidation. Hate to be a trapped Bitcoin bear right now.”
Another factor contributing to bitcoin’s positive outlook is the surge in retail investment.
According to data from CryptoQuant, retail investors have purchased approximately $135.7 million worth of bitcoin over the past month. This influx of capital from individual investors is a strong indicator of growing confidence in the bitcoin market.
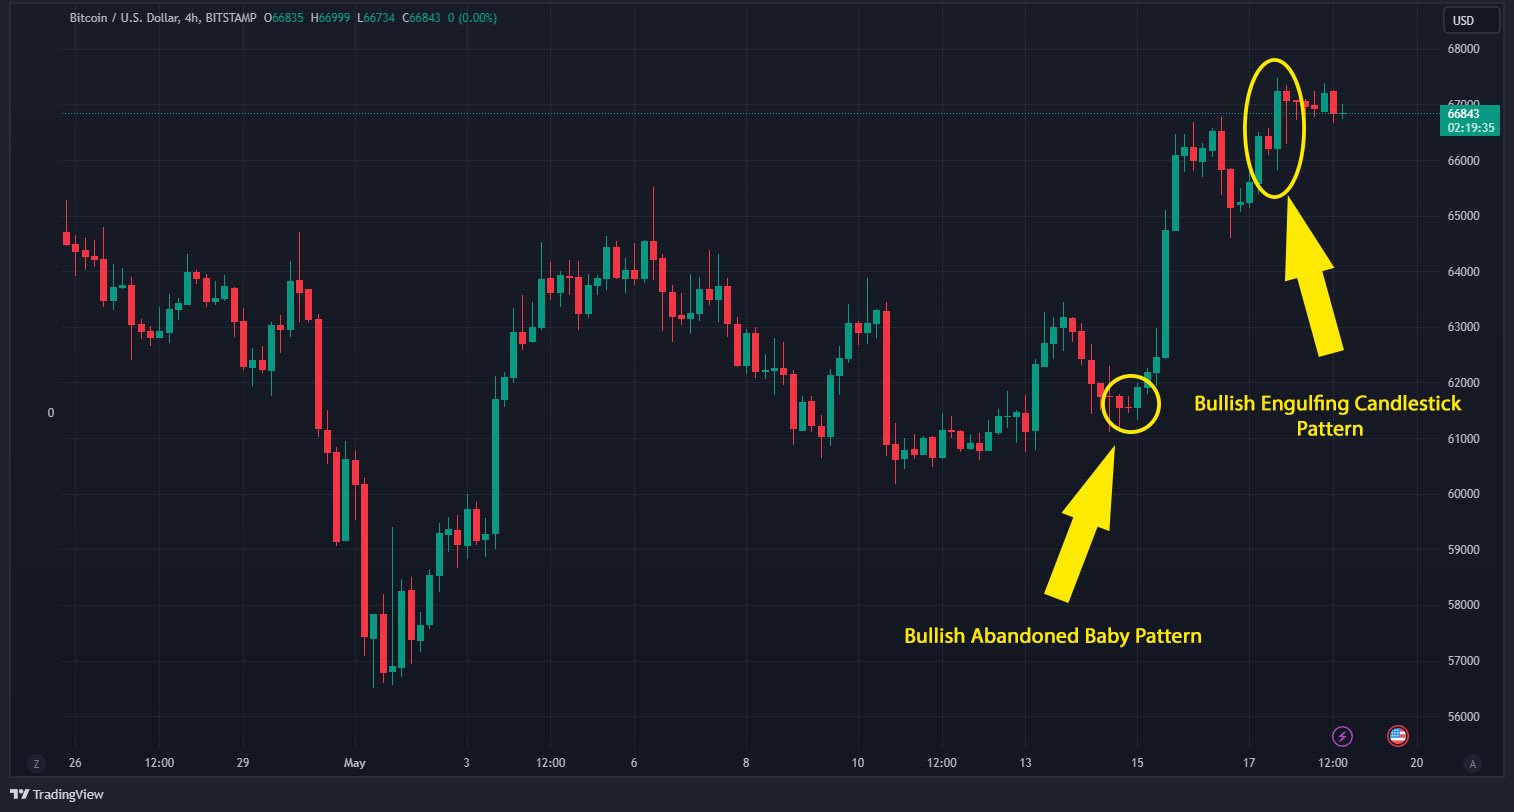
Technical analysis of bitcoin’s price charts also supports the bullish outlook. On the 4-hour timeframe, bitcoin has formed promising patterns such as the “bullish abandoned baby” and “bullish engulfing candlestick” patterns.

These technical indicators typically signal a continuation of upward momentum.
Other than these, analyst Crypto Jebb highlighted another bullish pattern known as the inverse head and shoulders.
This pattern, combined with other indicators like the Moving Average Convergence/Divergence (MACD), points to a strong potential for bitcoin’s price to reach new highs. Jebb stated that this pattern could propel bitcoin’s price to $100,000.
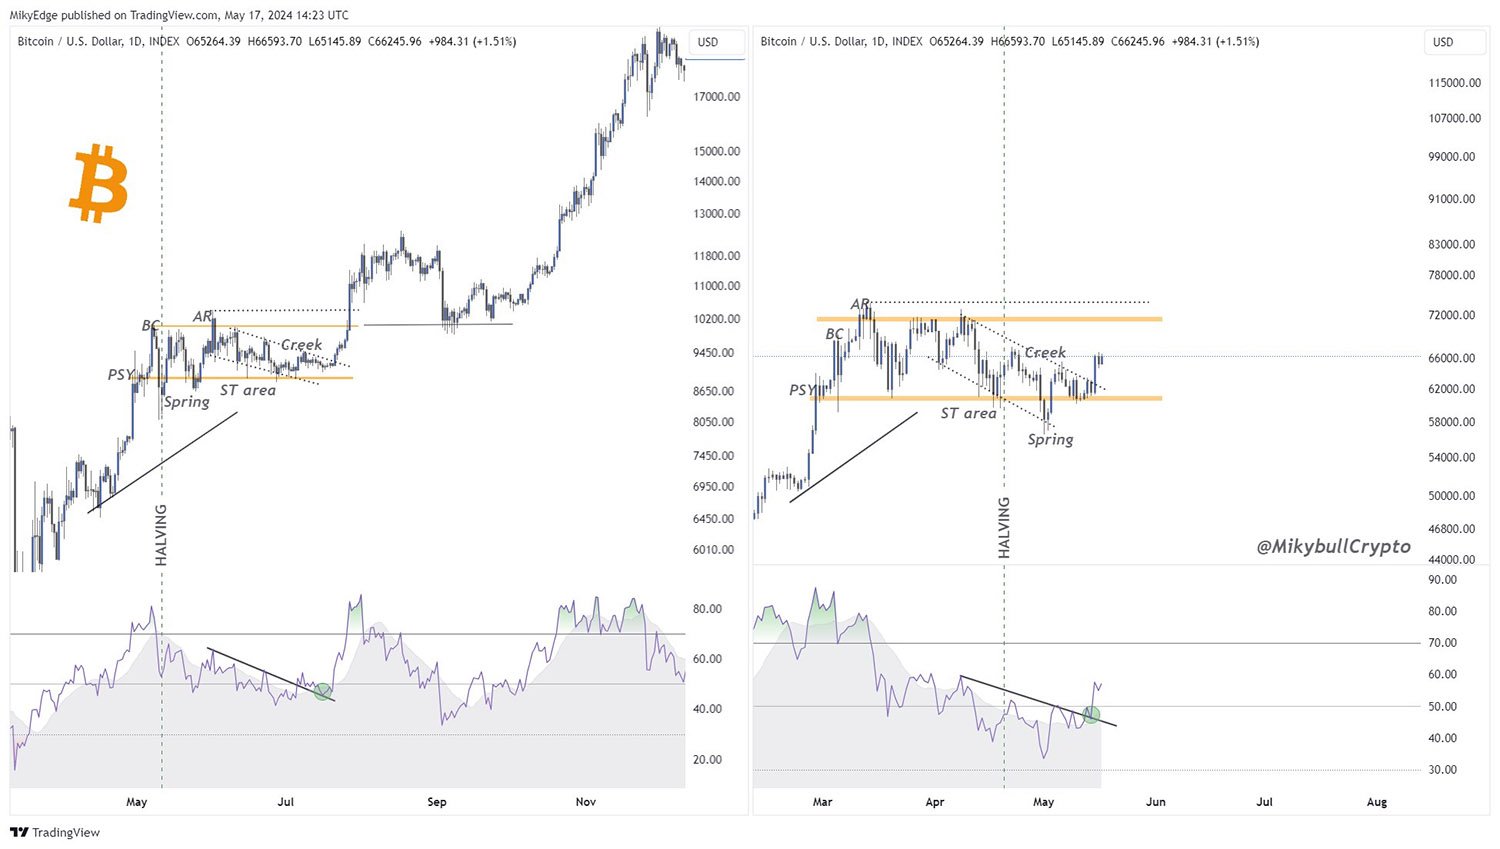
Another analyst noted that bitcoin’s current price movement closely resembles its 2020 post-halving trend, suggesting a potential takeoff if the pattern continues.

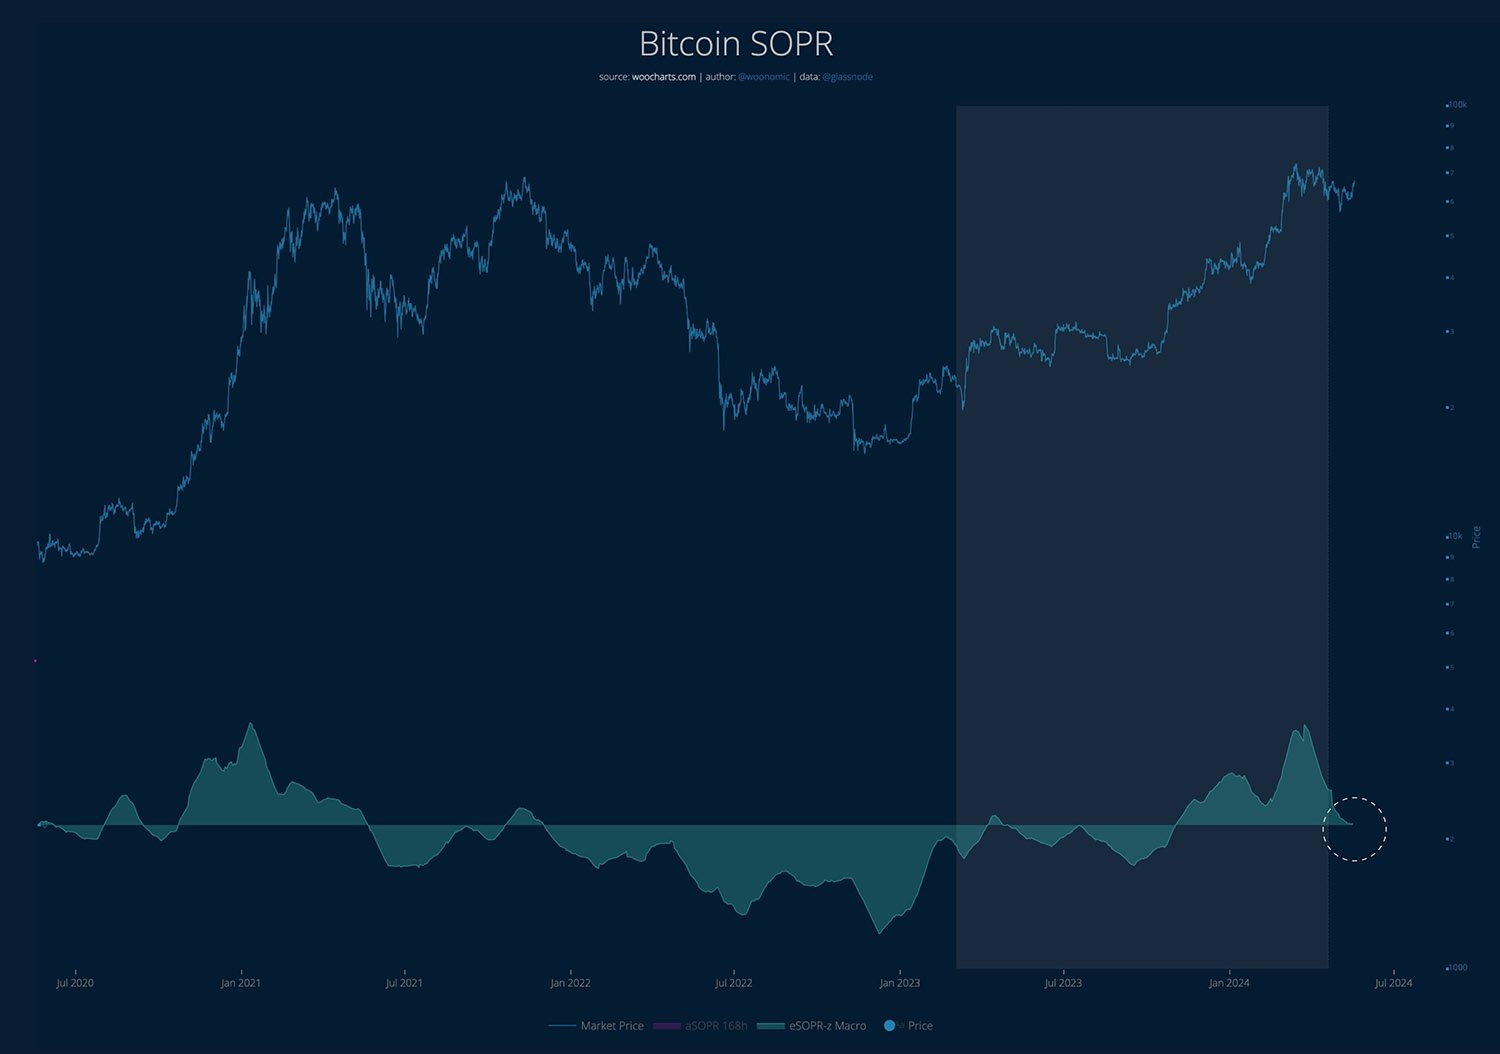
Furthermore, Woo mentioned that bitcoin is still in the early stages of its liquidity cycle and is undergoing a “very healthy reset” against a backdrop of increasing capital flows. This indicates that bitcoin is building a solid foundation for its next leg up.
He added: “Bitcoin SOPR (Spent Output Profit Ratio) update. Profit taking has completed, it took 2 months.”

The recent release of lower-than-expected Consumer Price Index (CPI) data has also contributed to bitcoin’s current bullishness. Lower inflation figures tend to boost investor confidence, leading to increased demand for assets like bitcoin.
Overall, the combination of expert analysis, technical indicators, and active market participation paints a promising picture for bitcoin’s future. As Woo pointed out:
“Bitcoin is in its liquidity cycle […] it’s still doing warm up exercises […] It’s consolidating under all time highs, during this time long time frame risk signal is quite low. Risk only starts climbing after the floodgates open.”


