Bitcoin has been on a roller coaster ride recently. Following a significant drop in its price, market analysts and veteran traders are drawing parallels between the current market trends and previous cycles.
Specifically, the recent movements are reminiscent of bitcoin’s behavior before the 2016 bull run, sparking optimism about a potential upcoming surge.
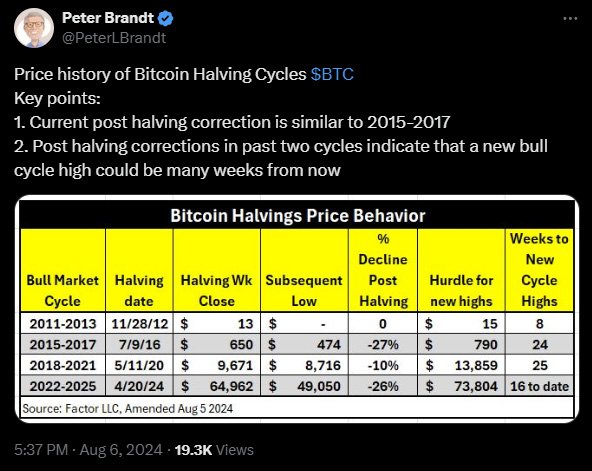
Peter Brandt, a well-respected trader in the community, has been vocal about the similarities between bitcoin’s current decline and its price action before the 2016 bull run.
In several posts on social media platform X, Brandt highlighted these patterns, suggesting that history might be repeating itself.

In 2016, the Bitcoin halving took place on July 9, with the price at $650. Following this event, the market experienced a drop to a low of $474 within a month, marking a 27% decline.
However, the price surged afterward, reaching a peak of $20,000 by December 2017. This significant rise followed a period of decline similar to what we are witnessing now.
Bitcoin’s price has recently seen substantial volatility. After reaching a peak of nearly $70,000 in late July 2024, it plummeted to around $49,050—a 26% drop.
This decline mirrors the post-halving corrections seen in previous cycles. As of early August, bitcoin has shown signs of recovery, bouncing back to trade above $55,000.
The asset’s price movements have sparked discussions among analysts and traders.
Although some see the recent decline as a precursor to a new bull run akin to what happened in 2016, others are cautious, suggesting that the market could experience further corrections before stabilizing.
The broader economic context also plays a crucial role in bitcoin’s price dynamics. Economist Jeremy Siegel has called for emergency interest rate cuts in response to recent market downturns. He emphasized:
“I’m calling for a 75 basis point emergency cut in the Fed funds rate, with another 75 basis point cut indicated for next month at the September meeting – and that’s minimum.”
Such measures could potentially rejuvenate the Bitcoin market, aligning with the Federal Reserve’s inflation and employment targets.
Other analysts have similar opinions, believing a rate cut at next Fed meeting is now inevitable. An analyst stated, “Odds of a 50 BP rate cut at the September FOMC are now at 98.5% !!”
The digital assets Fear and Greed Index, a tool that gauges market sentiment, recently entered the “Extreme Fear” zone, scoring 17 out of 100.
This is the lowest it has been since July 2022. This extreme fear often signals a buying opportunity for contrarian investors, suggesting that the market could be poised for a turnaround.
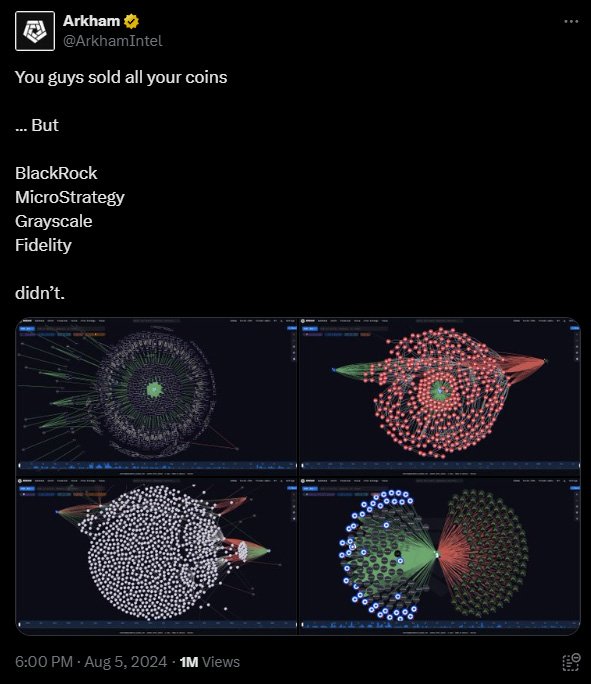
During the recent sell-off, major institutional investors like BlackRock, MicroStrategy, Grayscale, and Fidelity have maintained their bitcoin holdings.
Data from Arkham Intelligence indicates that they did not sell their positions, signaling confidence in bitcoin’s long-term potential. Arkham Intelligence noted that these major institutional investors remain unruffled in their sentiment towards bitcoin.

This behavior contrasts with the panic selling observed among short-term investors, who have been offloading their holdings amid the market downturn.
Technical analysis provides further insights into bitcoin’s potential trajectory.
The Relative Strength Index (RSI) on the daily chart recently hovered around 32, just above the oversold threshold. This suggests that bitcoin might experience a temporary relief rally before any further decline.
Peter Brandt and other analysts have pointed out that the recent price action is consistent with historical patterns.
“Please note that BTC decline since halving is now similar to that of the 2015-2017 Halving Bull market cycle,” Brandt remarked. If this pattern holds true, bitcoin could be on the cusp of a significant rally.
While the parallels with previous cycles are encouraging, some experts urge caution. Benjamin Cowen, founder of ITC Crypto, drew comparisons to 2019, when markets surged initially before undergoing a major correction.
This pattern suggests that bitcoin might face further volatility before any sustained upward movement. He stated:
“The 2019 BTC pattern is complete. Thank you to everyone who had an open mind and didn’t just assume it was up only. Now we get to find out if it’s a soft landing or a hard landing.”
Related: Kiyosaki: There is No Soft Landing, Bitcoin is Your Parachute
Tim Kravchunovsky, CEO of decentralized telecom network Chirp, added that macroeconomic factors are heavily influencing the market. He stated, “Over the coming hours and days, we may well see a decoupling of crypto from traditional stocks, similar to what we saw in 2020.”
He emphasized that bitcoin has the potential to recover more quickly than other risk assets, as seen during the pandemic-driven collapse in 2020.
He added, “Back then, crypto staged a much faster and more pronounced recovery from the pandemic-driven collapse than traditional stock markets, and we may well see something similar this time.”
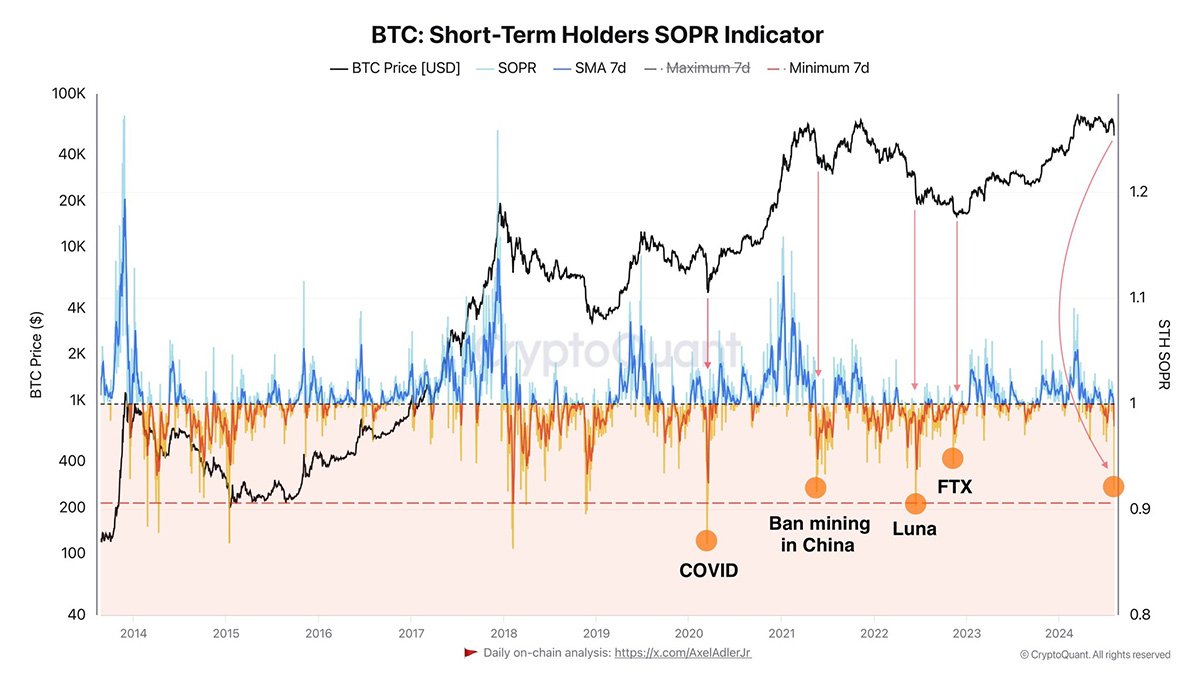
Axel Adler Jr., a verified author at CryptoQuant, has likened the bitcoin price drop on August 5 to significant past events such as the China mining ban and the FTX exchange collapse.
He supported his analysis with a graph displaying the BTC short-term holders’ SOPR indicator. He posted another update on his X account, expressing his hope that everyone is safe following what he called “Black Monday.”

Related: Bitcoin SOPR — Understanding a Key Metric in Profitability
Despite the current uncertainty, the overall sentiment among long-term investors remains positive. The holding pattern of major institutional investors and historical precedents suggest that bitcoin could be gearing up for another bull run.
Peter Brandt’s analysis underscores the importance of historical context in understanding market trends. His comparison of the current decline to the 2016 pre-bull run patterns offers a glimmer of hope for investors looking for signs of recovery.
As always, the Bitcoin market is influenced by a myriad of factors, including macroeconomic conditions, investor sentiment, and technical indicators.
While past performance is not always indicative of future results, the patterns identified by analysts like Brandt provide valuable insights into potential market movements.


