In recent days, bitcoin’s price has witnessed significant surges, with traders and analysts buzzing about the newfound momentum.
However, veteran trader John Bollinger, known for creating the widely used Bollinger Bands, has expressed caution amid this bullish sentiment, warning of potential short-term corrections for the digital asset.
Bitcoin has led the charge in the recent market upswing. Having surged by 7.8% in a single day, it broke through the $70,000 mark and reached a high of $71,500 before encountering resistance.
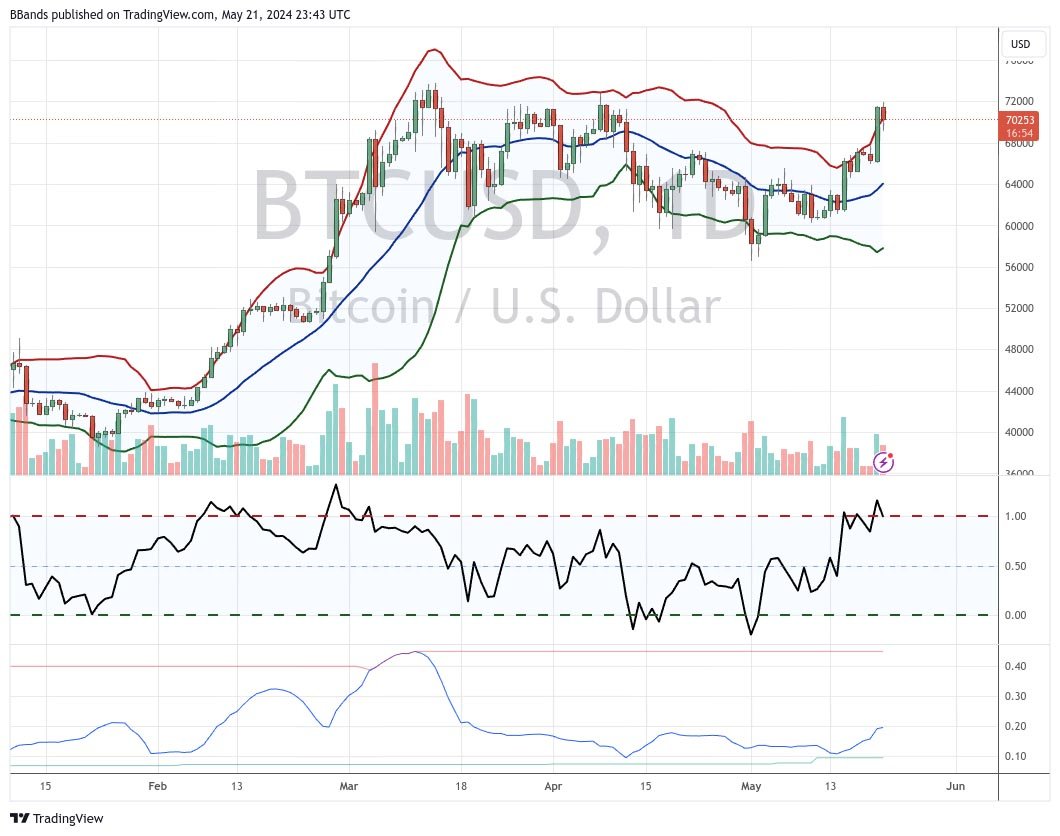
Despite the excitement, John Bollinger has advised caution. He pointed to a specific pattern in the price charts of bitcoin that suggest a potential pullback or consolidation period.
Bollinger highlighted this signal often indicates a temporary market correction. Bollinger remarked:
“I am not fond of the two-bar reversal at the upper Bollinger Band for BTCUSD. Suggests a consolidation or a pullback. Not bearish here, just short-term concerned.”

The expansion of the Bollinger Bands in bitcoin’s chart indicates increased market volatility, while the Relative Strength Index (RSI) is currently at 63, which is not yet in the overbought territory but suggests caution.
Bollinger Bands are widely used by traders to identify volatility and potential price reversals.
The bands consist of three lines: the lower band, the middle band (a 20-day simple moving average), and the upper band. These bands expand and contract based on price volatility, with the upper and lower bands set two standard deviations away from the middle band.
In bitcoin’s recent price chart, the two-bar reversal pattern Bollinger identified occurs when the price exceeds the upper Bollinger Band but then closes within it during the next trading period.
Such movements suggest that the upward momentum might be losing strength, leading to potential consolidation or a pullback.
While Bollinger’s short-term concerns are noteworthy, he remains optimistic about the long-term prospects of bitcoin. His cautious stance is based on technical indicators rather than a fundamentally bearish outlook.
This balanced perspective mirrors the current market sentiment, where optimism about future growth is tempered by an awareness of potential short-term volatility.
Bollinger’s warnings are not isolated. Other analysts have also expressed similar views.
Renowned analyst Willy Woo highlighted that while bitcoin’s price had not risen significantly over the past two months, there was a steady accumulation of available BTC. Woo believes it is only a matter of time before bitcoin surpasses its all-time highs.
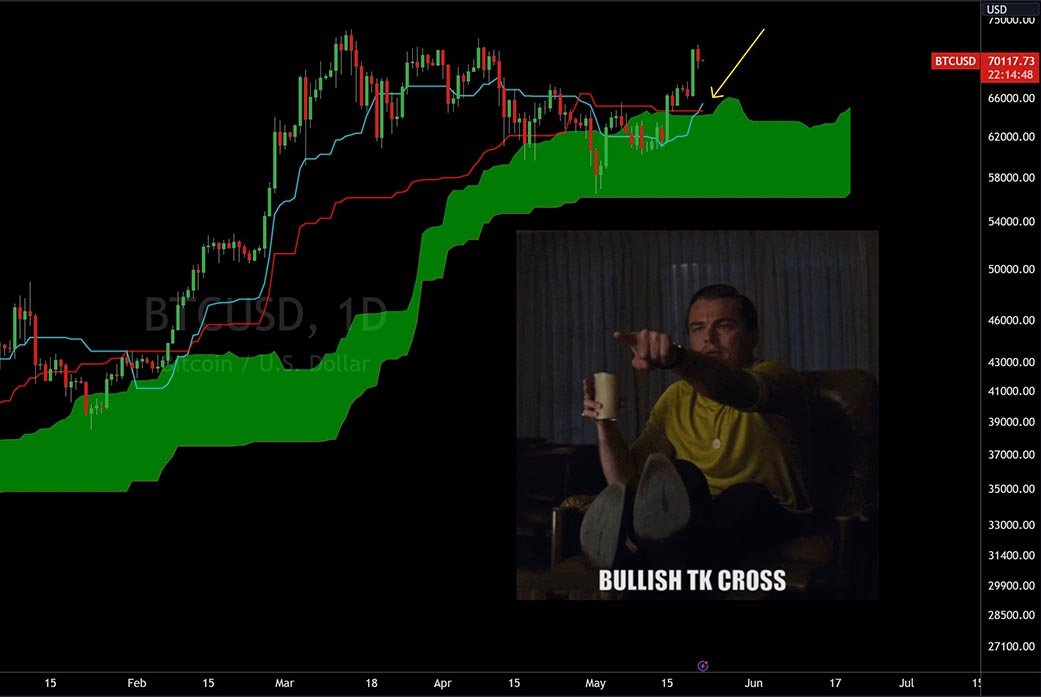
Moreover, Josh Olszewicz, another prominent analyst, shared a bullish outlook on bitcoin using the Ichimoku Cloud indicator.
He noted a “Bullish TK Cross with Price Above Cloud” on the daily bitcoin chart, a pattern that suggests increasing buying momentum and the potential start of a bullish phase.

This outlook provides a counterpoint to Bollinger’s short-term concerns, showing the complexity and diversity of market analyses.
At the time of writing, bitcoin is trading around the $68,000 mark. The market is closely watching to see if bitcoin can surpass its previous high of $74,000, a milestone that seems increasingly likely given the current trajectory.
The Bitcoin Fear and Greed Index, which stands at 76 now, indicates an extreme level of greed among traders, suggesting that many are in a buying mood. However, this level of optimism also raises the risk of a market correction.


