Bitcoin, the flagship digital asset, has experienced notable volatility in recent days as various US leading economic indicators shape its trajectory. A breakdown of the latest developments could signify what they mean for the digital asset.
Bitcoin Tumbles: US Leading Economic Indicators
Bitcoin experienced a significant drop of $5,000 within a 24-hour period as Treasury yields surged. The drop, spanning over two days, occurred alongside rising Treasury yields and strength in the U.S. dollar. Bitcoin fell more than 4.76% on Tuesday, reaching $66,134.00, with a two-day loss totaling 7%.
This drop followed reports of growth in the manufacturing sector and reduced investor expectations for rate cuts. As Joel Kruger, market strategist at LMAX Group, notes, “Bitcoin doesn’t need much excuse to go through a period of correction after such an explosive performance in Q1.”
He added:
“U.S. economic data has been stronger of late, all while inflation continues to be a concern. This has resulted in a repricing of Fed expectations, translating to broad-based U.S. dollar demand on the more attractive U.S. dollar yield differentials.”
Fed Signals Boost Bitcoin
However, bitcoin rebounded amid bullish signals from the U.S. Federal Reserve. Federal Reserve Chair Jerome Powell hinted at potential interest rate cuts before the end of 2024, stating:
“We have held our policy rate at its current level since last July, as shown in the individual projections the FOMC released two weeks ago, my colleagues and I continue to believe that the policy rate is likely at its peak for this tightening cycle. If the economy evolves broadly as we expect, most FOMC participants see it as likely to be appropriate to begin lowering the policy rate at some point this year.”
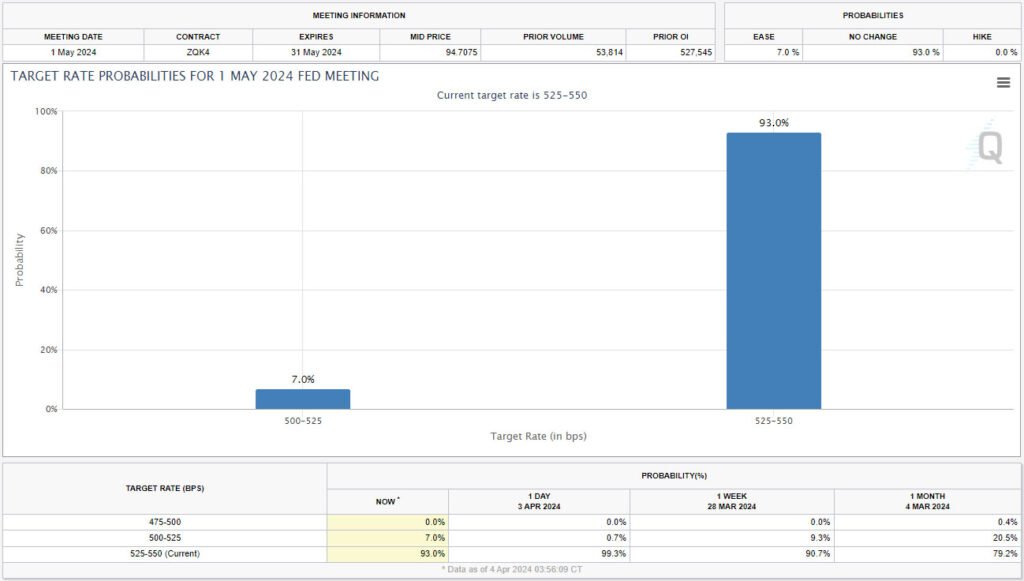
This dovish tone from the Fed provided positive sentiment for risk assets, including bitcoin. CME Group’s FedWatch Tool data suggests a 61% chance of a 0.25% rate cut in the upcoming meetings.

Analyst Predicts Bullish Breakout
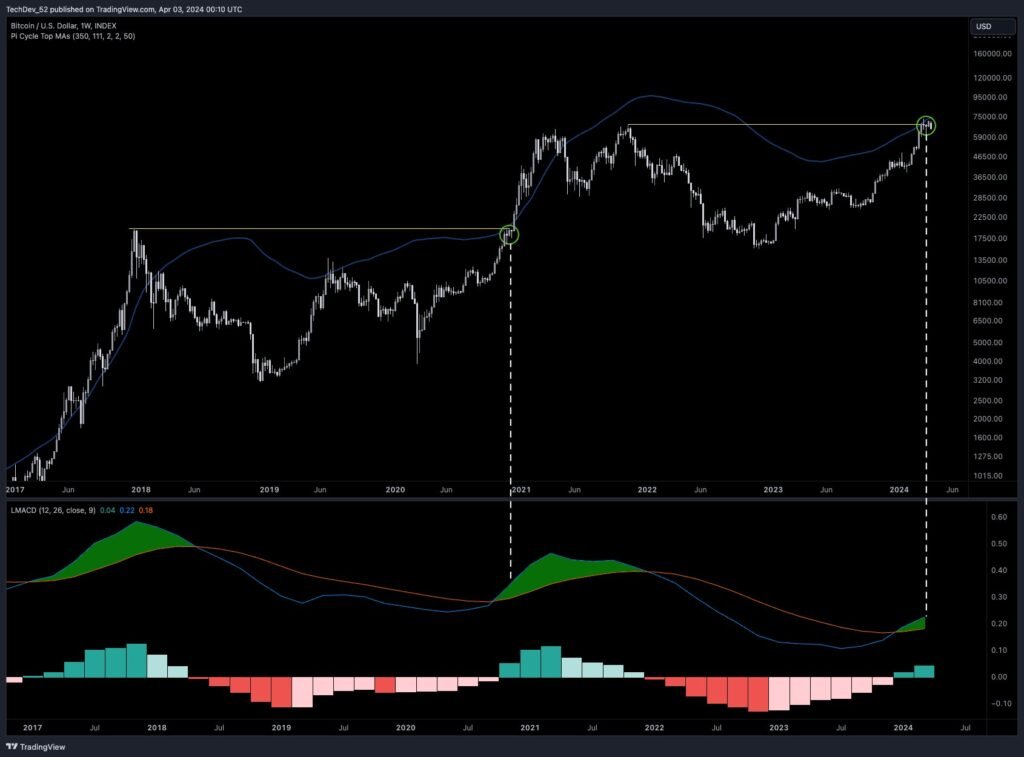
TechDev, a popular analyst on X, suggests that bitcoin may be gearing up for a massive breakout based on several indicators aligning. The Wyckoff accumulation schematic indicates a bullish trend for digital assets, with the analyst noting, “This is usually the place where things go vertical.”
Additionally, the Gaussian channel suggests that digital assets are primed for a significant uptrend, stating: “Once again at the intersection of the prior ATH and 2x 350-day moving average (DMA), with two-month MACD (moving average convergence divergence) in the green.” The analyst compares the current market to patterns observed in 2016 and 2020, which preceded substantial uptrends.

The analyst reveals bitcoin’s recent performance using Bollinger Bands Bandwidth (BBW), suggesting a potential surge. BBW measures volatility, expanding during calm periods and contracting before volatility spikes. He noted:
“Two-month expansion has only just begun. As RSI (Relative Strength Index) has only just crossed the channel EQ (equilibrium).”
Market Analysis and Technical Indicators
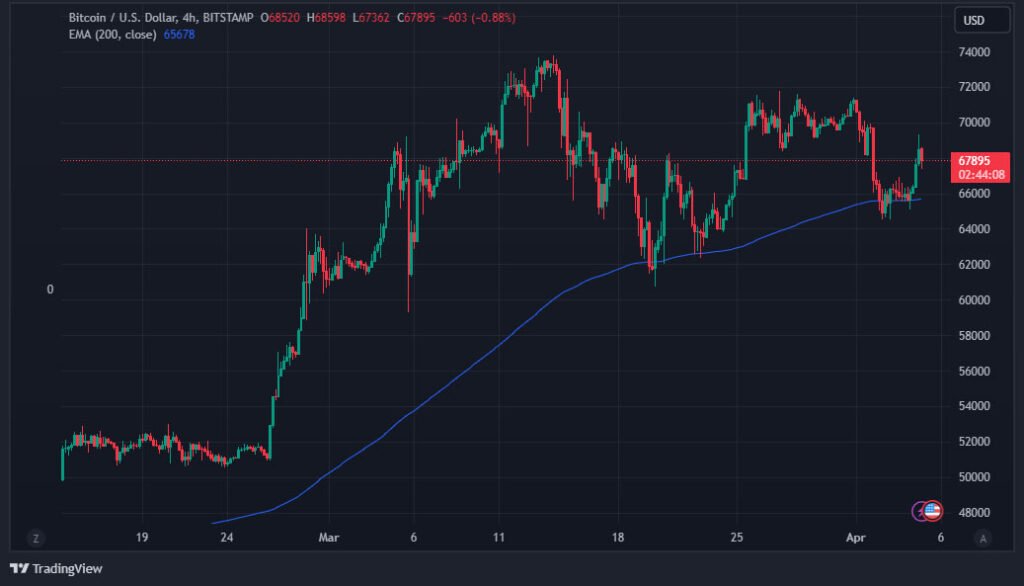
Analyzing the market structure, traders highlight key technical indicators. The 200-period exponential moving average (EMA) on 4-hour timeframes provides support for bitcoin. Furthermore, bitcoin’s relative strength index (RSI) has crossed back above the key 50-point level on the daily chart, indicating potential upside continuation. The MACD and Bollinger Bands Bandwidth (BBW) also signal potential price movements, with the BBW indicating that bitcoin is on the verge of soaring.

Remaining optimistic, trader Jelle observed positive signals on the daily chart, hinting at potential upward momentum. Bitcoin’s relative strength index (RSI) rebounded above 50 at the daily close after hovering near multi-month lows.
The trader stated:
“Bitcoin has locked in a hidden bullish divergence on the daily chart! This divergence often shows up during pullbacks, during a strong bullish trend – signalling the next leg higher. Bring on $82,000.”
Market Impact and Investor Sentiment
The volatility in bitcoin’s price has had an impact on related stocks and investor sentiment. Stocks tied to the performance of bitcoin experienced losses but traded off their lows. Digital asset exchange Coinbase fell 2%, while MicroStrategy and mining stocks like Marathon Digital and Riot Platforms also saw declines. Investor sentiment remains mixed as uncertainties regarding inflation, economic data, and potential rate cuts persist.
As Bitcoin approaches its halving event in April, investors anticipate potential market movements. Historically, the Bitcoin halving has led to significant rallies in the months following the event. Despite recent volatility, bitcoin remains up 55% for the year 2024, highlighting its resilience and potential for future growth.
Conclusion
Bitcoin’s recent price movements reflect a combination of economic factors, technical indicators, and investor sentiment. While volatility remains a characteristic feature of the market, bullish signals from the Federal Reserve and positive technical analysis suggest potential upside for bitcoin. As the market continues to evolve, investors will closely monitor economic indicators and technical signals to gauge bitcoin’s future trajectory.


